Our sustainability strategy is inspired by our purpose: Pioneers at heart for the good of generations. With our pioneering spirit, our knowledge, our products and technologies, we want to enrich and improve the lives of billions of people every day – and shape a viable future for the next generations.
SUSTAINABILITY
As reflected in our corporate values, we are committed to leadership in sustainability. As leaders, we aim to pioneer new solutions for sustainable development while continuing to shape our business responsibly and increasing our economic success.
Our strategy
Sustainability is thus a central element in our vision of the future. We want to actively drive the transformation to a sustainable economy and society, help protect and regenerate nature, contribute to strong communities and strengthen the trust of our stakeholders.
Our 2030+ Sustainability Ambition Framework sets our long-term ambitions in the three dimensions of Regenerative Planet, Thriving Communities and Trusted Partner and links to our high aspiration of achieving a “Transformational Impact for the Good of Generations”.


1 of 3


1 of 3


1 of 3

Looking ahead, we are well prepared: sustainability is deeply anchored in our business strategy and alive in our purpose. With that foundation, our sustainable transformation continues!
Sylvie Nicol, Executive Vice President Human Resources and Chair of Henkel’s Sustainability Council
Levers for Change


Our achievements 2025
Our sustainability strategy revolves around implementing our ambitions through concrete measures and projects to achieve practical progress. Below you find selected achievements of 2025:

-50 %
absolute Scope 1 and 2 GHG emissions (2030; vs. 2021)
![]()
-28 %
absolute Scope 3 THG emissions (2030; vs. 2021)

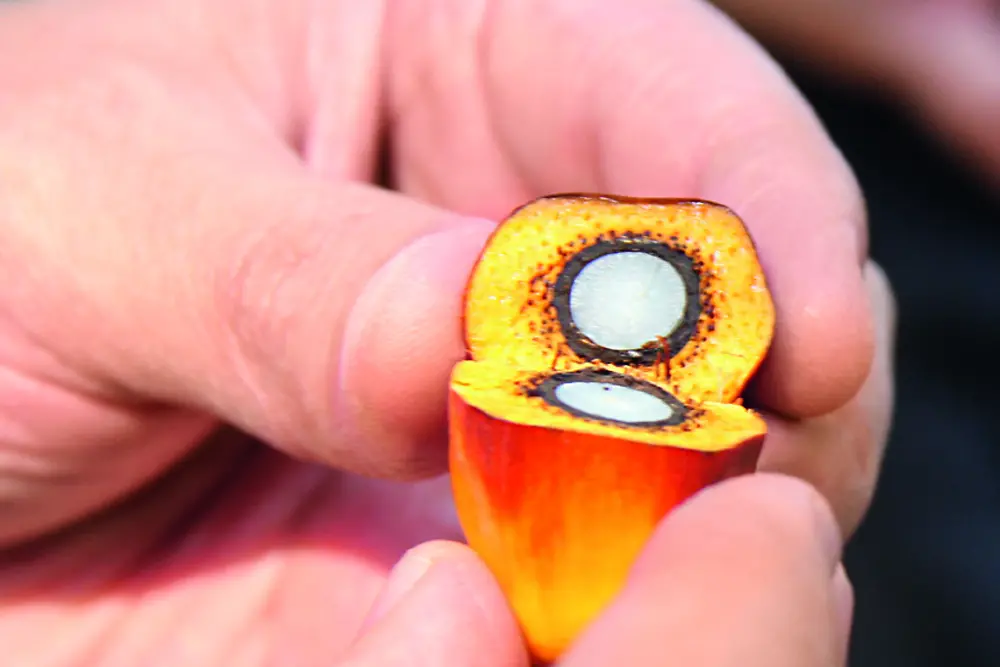
98 %
palm and palm kernel oil responsibly sourced and certified or externally verified

>24,000
TfS assessments and audits

100 %
of our products can be covered by lifecycle assessments

~40,000
smallholder farmers reached since 2013

43 %
of woman in management
![]()
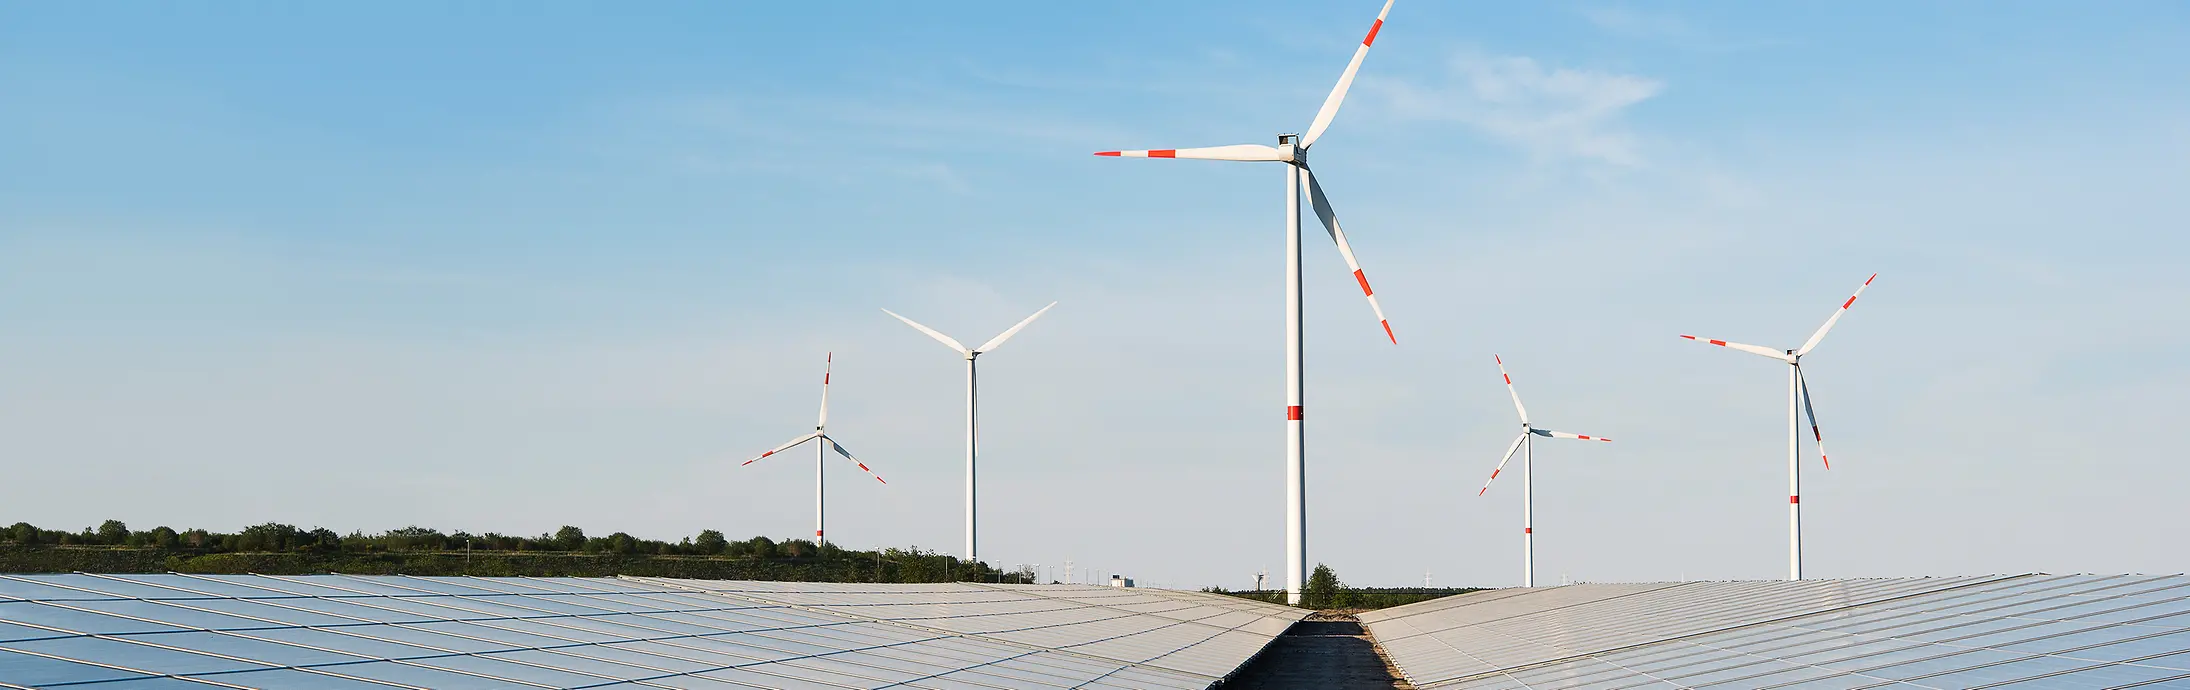
97 %
share of electricity sourced from renewable sources
![]()
88 %
of packaging designed for recycling or reusability

~1,500
fully paid Henkel gender neutral parental leave for almost 1,500 employees in 2025
1 of 10
External sustainability assessments
1 of 5
Our positions
At Henkel, we are committed to entering in dialog with others who are just like us dedicated to respecting diversity of opinion and constructive exchange of ideas. This is what prompted us to take an active part in important socio-political debates, by taking a closer look at selected topical issues.
Collaboration and partnerships
1 of 16