Investor Fact Sheet
Henkel was founded in 1876. With its brands, innovations and technologies, Henkel holds leading market positions worldwide in the industrial and consumer businesses. The business unit Adhesive Technologies is the global leader in the market for adhesives, sealants and coatings. With Consumer Brands, the company holds leading positions especially in laundry & home care and hair in many markets and categories around the world. The company employs about 50,000 people worldwide. Henkel’s preferred shares are listed in the German stock index DAX.
| Key financials | |||
| in million euros | 2024 | 2025 | +/- |
| Sales | 21,586 | 20,495 | -5.1% |
| Organic sales growth | 2.6% | 0.9% | – |
| Adjusted1 operating profit (adjusted EBIT) | 3,089 | 3,026 | -2.0% |
| Adjusted1 return on sales (adjusted EBIT margin) | 14.3% | 14.8% | 0.5pp |
| Adjusted1 earnings per preferred share (adjusted EPS) (in euros) - at constant exchange rates | 5.36 | 5.33 | -0.6% |
| Dividend per preferred share (in euros) | 2.04 | 2.07 | +1.5% |
| 1 Adjusted for one-time expenses and income, and for restructuring expenses pp = percentage points | |||
Growth in sales after adjusting for effects arising from acquisitions, divestments and foreign exchange effects – i.e. “top line” growth generated from within. Also excluded from the calculation are the effects arising from the application of IAS 29 (Financial Reporting in Hyperinflationary Economies) for Türkiye.
Financial Glossary SchließenEarnings Before Interest and Taxes (EBIT) adjusted for exceptional items in the form of one-time expenses and income, and for restructuring expenses.
Financial Glossary SchließenAbbreviation for Earnings Before Interest and Taxes. Standard profit metric that enables the earning power of the operating business activities of a company to be assessed independently of its financial structure, facilitating comparability between entities where these are financed by varying levels of debt capital.
Financial Glossary Schließen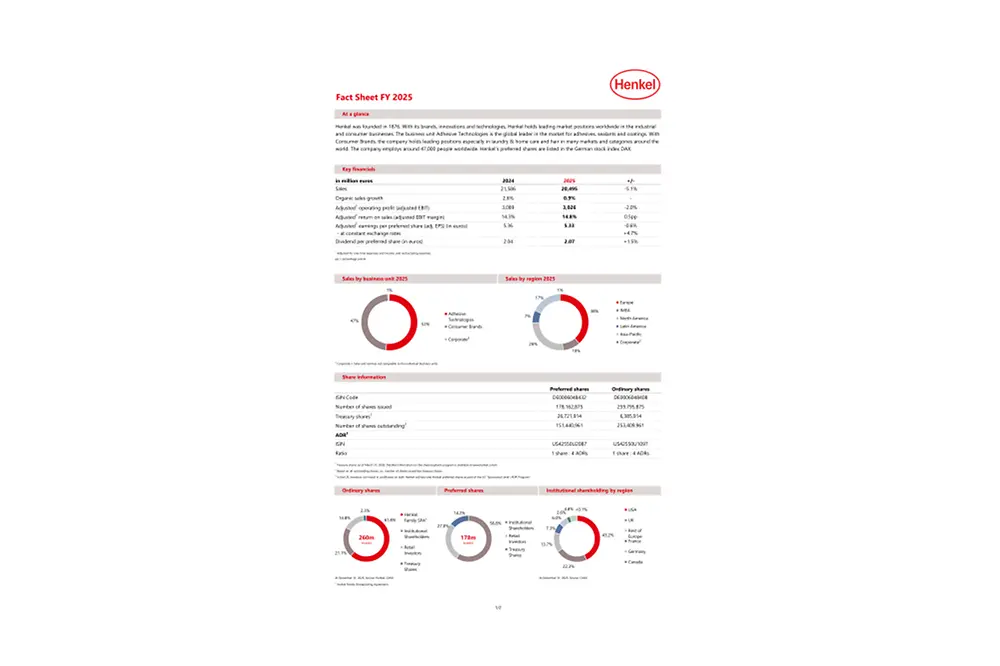
Share information
Preferred shares | Ordinary shares | |
|---|---|---|
| ISIN Code | DE0006048432 | DE0006048408 |
| Number of shares issued | 178,162,875 | 259,795,875 |
| Treasury shares1 | 26,721,914 | 6,385,914 |
| Number of shares in circulation | 151,440,961 | 253,409,961 |
| ADR2 |
|
|
| ISIN | US42550U2087 | US42550U1097 |
| Ratio | 1 share : 4 ADRs | 1 share : 4 ADRs |
| 1 Treasury shares as of March 31, 2026. Detailed information on the share buyback program is available here. 2 In the US, investors can invest in certificates on both Henkel ordinary and Henkel preferred shares as part of the US “Sponsored Level I ADR Program”. | ||
1 of 4
Top 3 brands
1 of 4
Excellent performance in ratings and rankings

1 of 2
1 Figure relates to the 2025 fiscal year compared to the 2021 base year.